Valet on the Voight-Kampff test – How to test Machine Learning?
The main question we had during Valet development was — “How do we check whether it works or not?” We spent about two weeks on that, so let us share our insights!

What's Valet? You can read more about the cloud-based and self-hosted versions of our ML prototype in our previous articles.
Machine Learning basics 👶
But first, you need to understand the basic concepts.
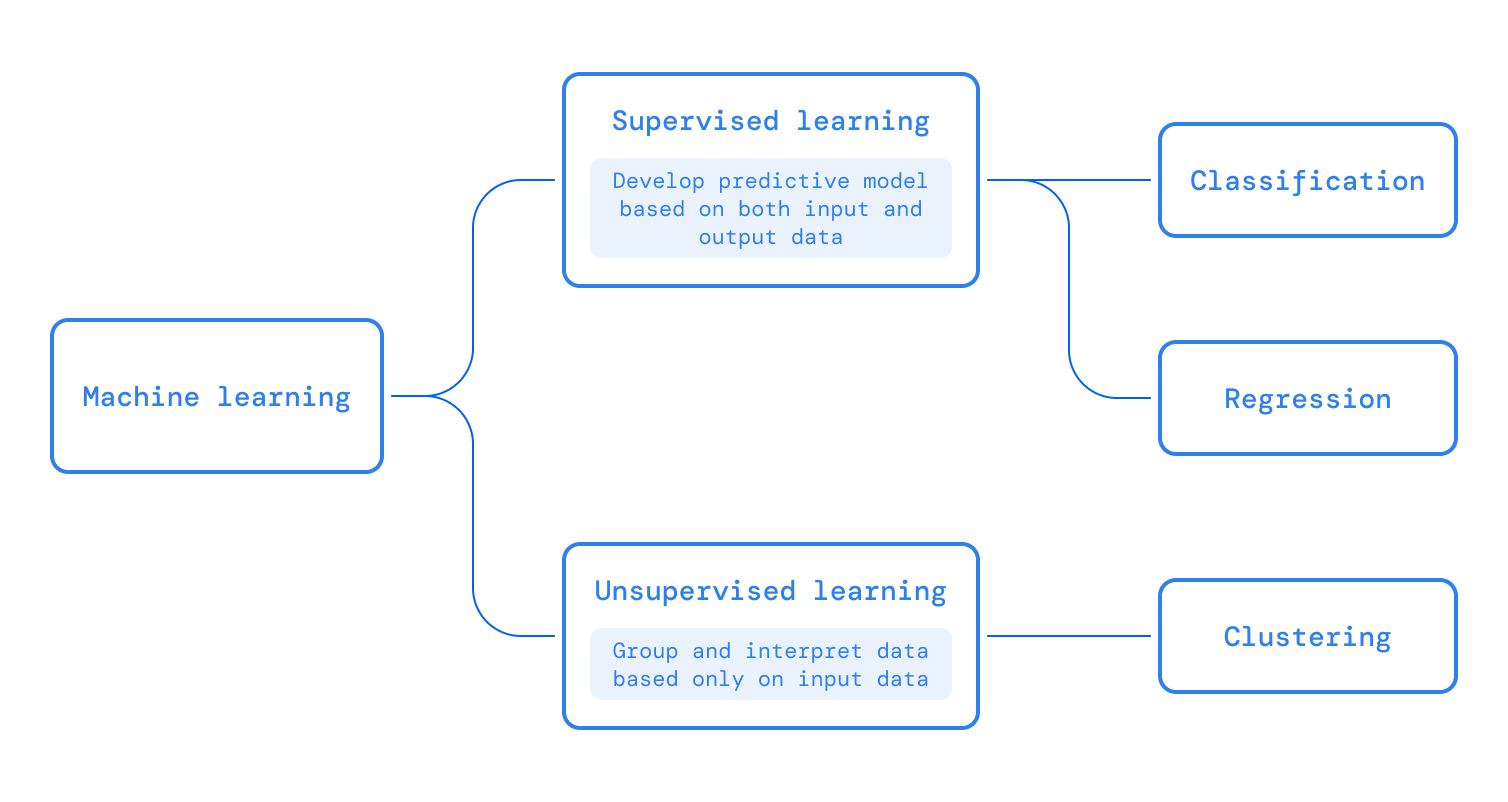
Machine Learning or models represent a class of software that learns from a given set of data and then makes predictions on the new data set based on its learning. Machine learning models are trained with an existing data set in order to make the prediction on a new data set.
This class of learning algorithms is also called supervised learning. Algorithms discover hidden patterns or data groupings without human intervention, called unsupervised learning.

Types of supervised learning models:
- Regression models are used to make numerical predictions. For example, what would be the stock price on a given day?
- Classification models are used to predict the class of a given data. For example, whether a person is suffering from a disease or not.
Types of unsupervised learning models:
- Clustering is the task of dividing the population or data points into a number of groups such that data points in the same groups are more similar to other data points in the same group and dissimilar to the data points in other groups. It is a collection of objects on the basis of similarity and dissimilarity between them.

Please note that the machine learning algorithm doesn’t generate a definite result output but it provides an approximation or a probability of the outcome.
How to test probability? 🫣
The word "testing" with Machine Learning models is primarily used for testing the model performance in terms of accuracy/precision of the model. Note that the word "testing" means different things for conventional software development and Machine Learning model development.
Machine Learning models would also need to be tested as conventional software development from the quality assurance perspective. Techniques such as black/white box testing are applicable to machine learning models as well as to perform quality control checks on machine learning models.
In order to test a machine learning algorithm, the tester defines three different datasets:
- Training dataset
- Validation dataset
- Test dataset (a subset of the training dataset).
Please keep in mind the process is iterative in nature, and it’s better if we refresh our validation and test dataset on every iterative cycle.
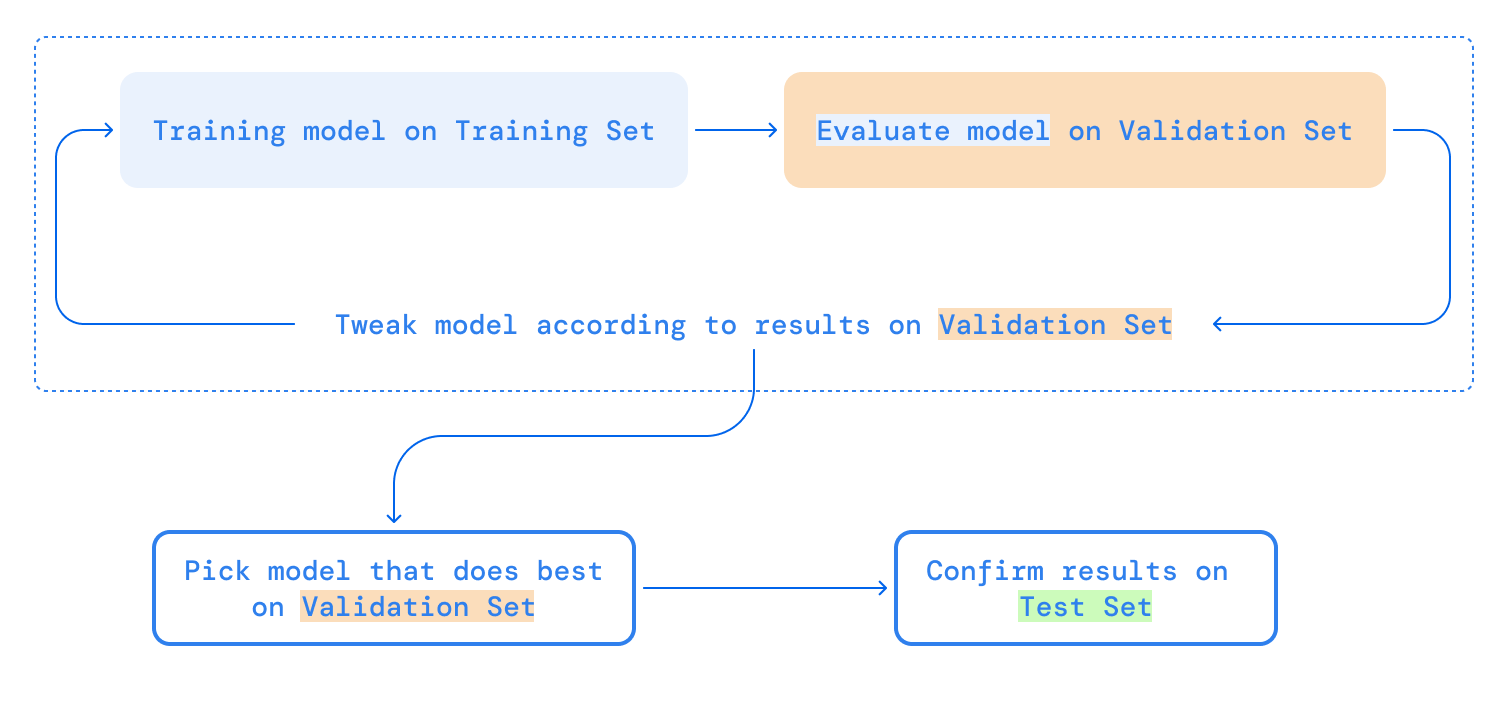
Here, below is the basic approach a tester can follow in order to test the developed learning algorithm: Train → Validate → Evaluate

- Tester first defines three datasets, training dataset (65%), validation dataset (20%) and test dataset (15%). Please randomize the dataset before splitting and do not use the validation/test dataset in your training dataset.

- The tester begins to train the models with the training dataset. Once this training model is done, the tester then evaluates the models with the validation dataset. This is iterative and can embrace any tweaks/changes needed for a model based on results that can be done and re-evaluated. This ensures that the test dataset remains unused and can be used to test an evaluated model.
Once the evaluation of all the models is done, the best model that the team feels confident about based on the least error rate and high approximate prediction will be picked and tested with a test dataset to ensure the model still performs well and matches with validation dataset results.
If you find the model accuracy is high then you must ensure that test/validation sets are not leaked into your training dataset.
Validation 🎰
Hold-out is splitting up your dataset into ‘train’ and ‘test’ sets. The training set is what the model is trained on, and the test set is used to see how well that model performs on unseen data. A typical split when using the hold-out method is using 80% of the data for training and the remaining 20% for testing.
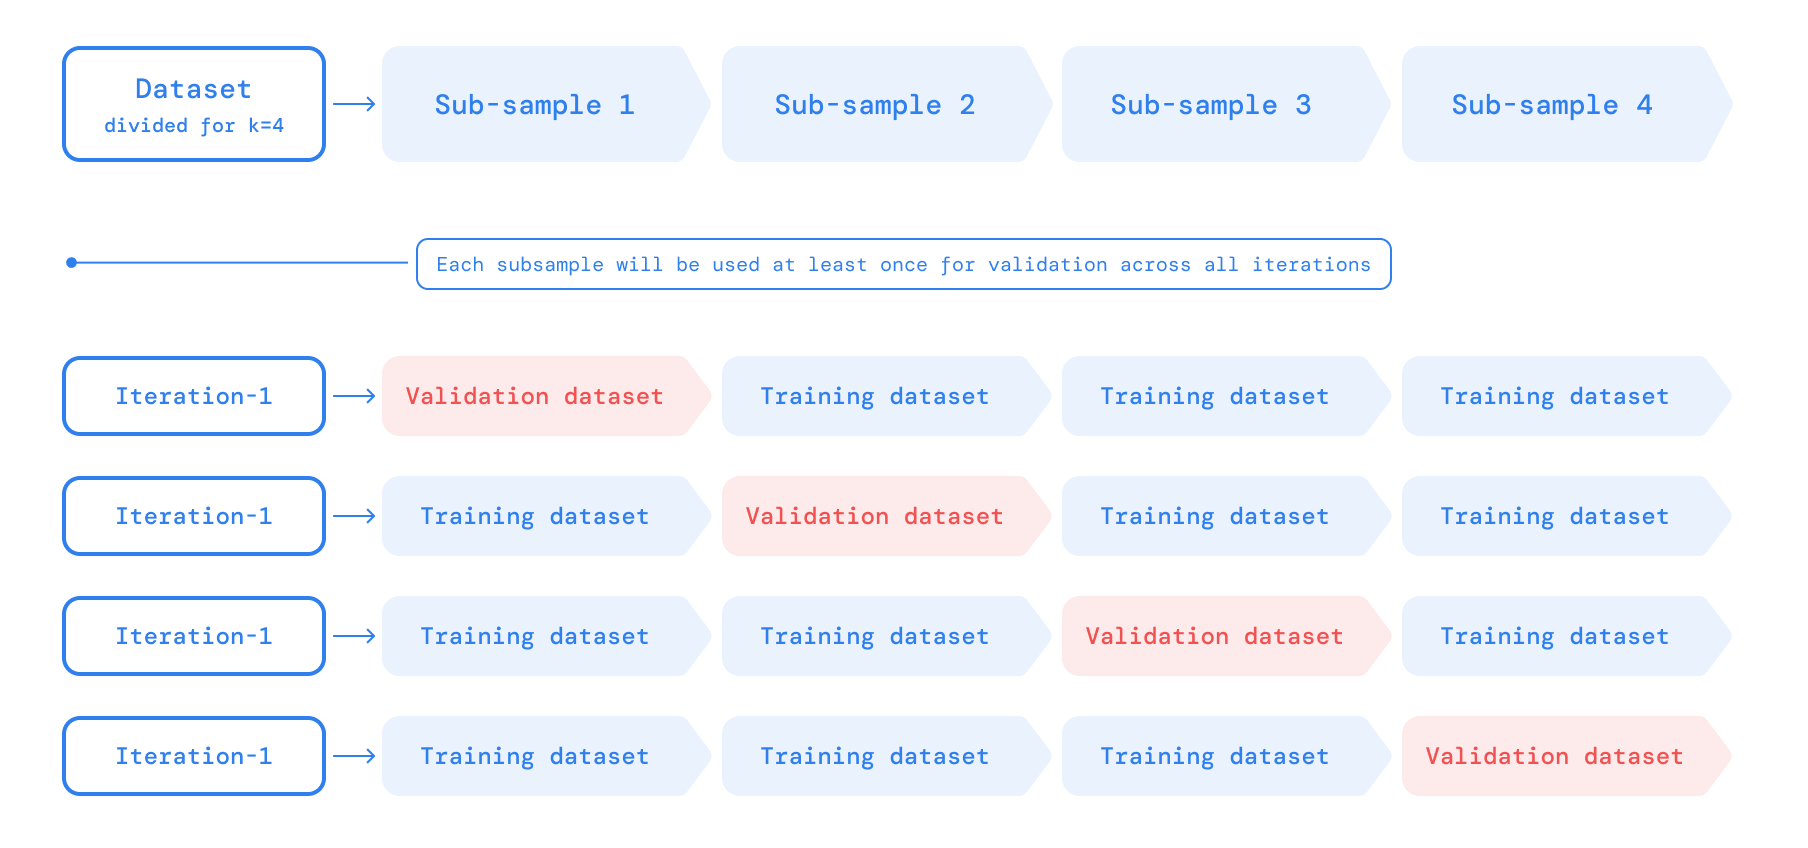
Cross-validation is a technique that split the datasets into multiple subsets and learning models are trained and evaluated on these subsets of data. One of the widely used techniques is the k-fold cross-validation technique.
In this, the dataset is divided into k-subsets (folds) and is used for training and validation purposes for k iteration times. Each subsample will be used at least once as a validation dataset and the remaining (k-1) as the training dataset. Once all the iterations are completed, one can calculate the average prediction rate for each model.

Hold-out vs Cross-validation 🤼♀️
Cross-validation is usually the preferred method because it gives your model the opportunity to train on multiple train-test splits. This gives you a better indication of how well your model will perform on unseen data. Hold-out, on the other hand, is dependent on just one train-test split. That makes the hold-out method score dependent on how the data is split into train and test sets.
The hold-out method is good to use when you have a large dataset, you’re on a time crunch, or you are starting to build an initial model in your data science project. Keep in mind that because cross-validation uses multiple train-test splits, it takes more computational power and time to run than the hold-out method.
Evaluation 💯
Let’s learn a few new words:
- True positives (TP) is an outcome where the model correctly predicts the positive class.
- True negatives (TN) is an outcome where the model correctly predicts the negative class.
- False positives (FP) is an outcome where the model incorrectly predicts the positive class
- False negatives (FN) is an outcome where the model incorrectly predicts the negative class.
- The threshold is a value used by the model to categorize the outcome into a particular classification.
- Classification Accuracy: It’s the most basic way of evaluating the learning model. It’s a ratio between the positive (TN+TP) predictions vs. the total number of predictions. If the ratio is high, then the model has a high prediction rate. Below are the formulas to find the accuracy ratio:

- Precision identifies the frequency with which a model was correct when predicting the positive class. This means the prediction frequency of a positive class by the model. Let’s calculate the precision of each label/class using the above tables.

- Recall answers the following question: Out of all the possible positive labels, how many did the model correctly identify?. This means, the percentage of correctly identified actual True Positive class. In other words, recall measures the number of correct predictions, divided by the number of results that should have been predicted correctly.

- F-score: Accuracy alone is not a good way to evaluate the model. For example, out of 100 parking spaces, the model might have correctly predicted True Negative cases however it may have a less success rate for True Positive ones. Hence, the ratio/prediction rate may look good/high but the overall model fails to identify the correct available parking spaces.
The F-score, also called the F1-score, measures a model’s accuracy on a dataset. It is used to evaluate binary classification systems, which classify examples into ‘positive’ or ‘negative’. The F-score is a way of combining the precision and recall of the model, and it is defined as the harmonic mean of the model’s precision and recall.

Valet results 🏎
Now that we get all the “jargon,” let’s calculate Accuracy, Precision, Recall, and F-score for Azure and Yolo solutions. Here is an example for the first dataset:

We split the set into ten subsets for cross-validation, so we did this calculation ten times and calculated averages:

Yolo has a 0.96 F-score, and Azure has 0.71. The conclusion is simple – Azure works, Yolo rocks! 🤘
It was a fantastic experience working with Yarik, Stas, and Vova! These two weeks have been a real roller coaster: research, dead ends, whole days of googling, rocket-science calculations, and finally, a finished product built on technologies from Blade Runner!” – Yevgeni Shantyko, QA Engineer


